Knowing whether a competitor is spending $4,000/month or $20,000/month on Google Ads changes how you respond. The right budget allocation, keyword focus, and bidding strategy all depend on that number to stay competitive.
There is no direct method to find your competitor’s ad spend. Google does not share advertiser spend data publicly, and no tool can give you a precise figure.
But by combining Google’s own tools, third-party tools’ intelligence, and manual search observation, you can build an estimate accurate enough to act on.
This guide covers different methods available in 2026: Google Auction Insights, Keyword Planner, the Ads Transparency Centre, third-party tools, plus a calculation method you can apply directly to your market.

Table of contents:
- Why Competitor Budget Analysis Matters
- Method 1: Using Google Tools for Budget Clues
- Method 2: Third-Party Competitive Analysis Tools
- Method 3: Search Manually
- Final Step: Calculate Competitors’ Ad Spend
- Using Competitor Data to Your Advantage
- Expert Google Ads Competitor Analysis
- FAQs
Why Competitor Budget Analysis Matters
Knowing what a competitor spends changes how you approach your own campaigns.
- Benchmarking Performance: Knowing what competitors spend on Google Ads gives you a real advantage to stay competitive and apply creativity to boost the outcome of your marketing efforts. Without it, you are setting budgets and targets based on guesswork.
- Understanding Market Position: A competitor with a significantly larger ad spend is either investing aggressively because the returns justify it, or burning money inefficiently. Knowing which is critical.
- Targeting Right Keywords: Competitor spend signals which keywords are worth the investment and which are saturated. You can find the gaps where you can compete effectively without overspending.
How accurate are competitor Google Ads budget estimates?
Not exact, but accurate enough to act on, if you use multiple data sources to validate data and calculate.
A single tool estimate in isolation is rough. Cross-referencing three data points: your own Auction Insights data, a tool like SpyFu, and manual search observation, typically produces an estimate within a reliable range.
The goal is not a precise figure. The goal is an actionable range: enough to know whether a competitor is spending $3,000/month or $15,000/month, because your response to each scenario (lower, mid or high-range spend) is completely different.
Method 1: Using Google Tools for Budget Clues
Google’s own tools provide the closest signals available, especially if you are already running Google Ads campaigns.
Though these data come directly from Google, you need to know how to interpret them.
Google Ads Auction Insights Report
Auction Insights is one of the most underused reports in Google Ads. It gives you real comparative data against competitors who are bidding on the same keywords as you.
Note: You need to be actively running Google Ads campaigns to access this report. If you spend very low then you may not have enough data to assess.
Access Path: Google Ads → Insights and reports →Auction insights.
Note: Google only populates the Auction Insights report when your impression share for the selected segment is above approximately 10%. Below that threshold, the report appears empty.
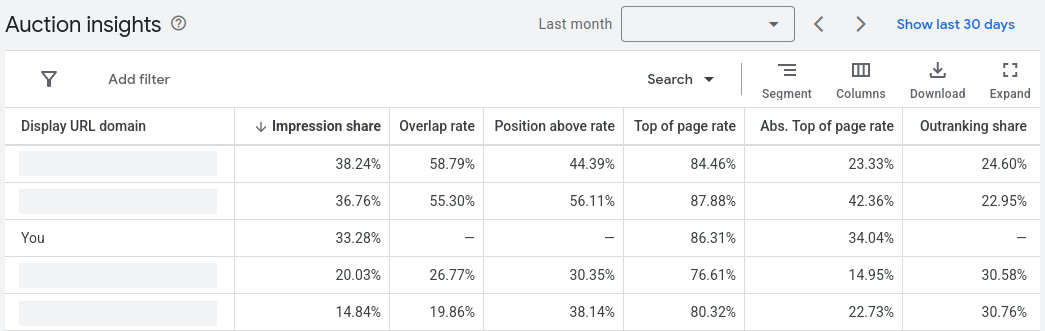
Key metrics and what they tell you
Impression Share
- The percentage of total eligible impressions your ad received versus the total available.
- If a competitor consistently shows a higher impression share than yours, they are likely bidding more aggressively, carrying a higher daily budget, or both.
- A competitor with 80%+ impression share over an extended period is not getting there by accident. That requires a substantial and sustained budget.
Overlap Rate
- It represents how often your ads and a competitor’s ads appear together in the same auction.
- A high overlap rate confirms you are targeting the same keywords and audience.
- If their ads appear consistently in those shared auctions, they have enough budget to remain visible throughout the day.
Position Above Rate
- This represents how often a competitor’s ad appears in a higher position than yours when both ads are shown.
- If a competitor consistently outranks you across multiple keywords, they are either bidding higher, have a better Quality Score, or both.
- Sustained positional dominance requires both investment and campaign structure discipline.

Top of Page Rate
- The percentage of times an ad appeared at the very top of search results (above organic).
- Appearing at the top of Google consistently is expensive. A competitor with a high top-of-page rate is making a deliberate investment in premium placement and paying for it.
Outranking Share
- How often your ad ranked higher than the competitor’s, or showed when theirs did not.
- Low outranking share against a specific competitor signals a budget or Quality Score gap. It is worth investigating which one before increasing spending.

Reading patterns over time
Pull Auction Insights data across different date ranges: last 7 days, last 30 days, last 90 days. Seasonal budget spikes, gaps in evening coverage, and reduced weekend presence all become visible in the pattern. These are not just budget signals. They are strategic signals.
Important: Invest time to read these patterns, it can change how you think about your ad spend and online presence.
Google Ads Keyword Planner
You cannot calculate a competitor’s budget without knowing the cost-per-click (CPC) of the keywords they are bidding on.
If you are already running Google Ads
Go to your Google Ads account → Set the date range to “Last 30 days” →Click on the specific campaign → Ad Group → Find the Avg. CPC column at the bottom.
This is your most accurate CPC reference because it reflects actual market conditions in your niche. Your competitor may have a similar, higher or lower value.
If you are not yet running Google Ads
Go to Google Keyword Planner and enter your primary target keywords. Look at the top-of-page bid (high range) for each keyword. This represents what advertisers are paying for premium placement. Average those figures to get a working CPC estimate.
Record this figure. You will use it in the final step of the calculation.

Google Ads Transparency Centre
The Google Ads Transparency Centre lets anyone view the ads a business is currently running or has run historically, with no Google Ads account required.
It was built for ad accountability, but for competitive research, it is genuinely useful.
How to use it:
- Go to adstransparency.google.com
- Enter a competitor’s domain name to see their ads targeted for a specific country
- Tip: If a competitor’s domain returns no results, search their company’s legal name instead.
What to Look For
- Search Ads Volume: The number of active or recently active search ads signals campaign scale. A competitor running 15 to 20 active search ads across multiple ad groups is investing significantly more than one running 3 generic ads. The scale represents the budget.
- Ad Formats & Channels: Search ads are the most expensive Google Ads format. If a competitor is running search ads alongside Display and YouTube, it signals a diversified and larger overall budget. Display and YouTube alone tend to indicate a lower-cost brand awareness focus.
- Ad Frequency: The Transparency Centre does not show exact ad frequency, but you can get a rough idea through live manual search (covered in Method 3). The Transparency Centre tells you what they are running; a manual search tells you how aggressively they are running it.

Method 2: Third-Party Competitive Analysis Tools
Third-party tools can provide valuable insights on estimated click volumes, keyword positions, historical data, and average CPC. These tools are not perfect, but they provide valuable insights fast.
The three most useful tools are SpyFu, Semrush, and Ahrefs. SpyFu is the PPC specialist built for paid search intelligence; Semrush is the broadest platform with strong paid and organic overlap data; Ahrefs is built for depth on keyword discovery and landing page analysis.
Use at least two to cross-reference estimates.
SpyFu
SpyFu is purpose-built for paid search intelligence. If your primary goal is estimating Google Ads budgets and reverse-engineering a competitor’s paid keyword strategy, start here.
How to use SpyFu
Step 1: Enter Competitor Domain
Go to SpyFu.com, enter the competitor’s domain into the search bar, and navigate to the PPC Research section.
Step 2: Read PPC Overview
At the top of the PPC overview, you will see:
- Estimated Monthly Paid Clicks: their total click volume from paid search
- Estimated Monthly Ad Budget: SpyFu’s dollar estimate of their monthly spend
- Number of Paid Keywords: the breadth of their paid keyword targeting
Step 3: Deeper Keyword Analysis
Click through to their full paid keyword list. Look at:
- Which keywords are they prioritising? Are they heavy on brand terms (cheaper, lower intent) or non-brand commercial terms (expensive, high-intent)?
- What ad copy are they using? Repeated messaging across many keywords means tested, high-performing copy.
- Are there keywords they are bidding on that you are not? These are gaps worth investigating.
What SpyFu does well: Historical data. You can see how a competitor’s paid keyword count and estimated spend have trended over months or years, revealing seasonality, growth trajectory, and strategic pivots.
Semrush
Semrush gives you a strong “Traffic Cost” estimate, the estimated monthly value of a competitor’s paid search traffic, which is a useful cross-reference against SpyFu’s direct budget estimate.
How to Use Semrush
Step 1: Enter Competitor Domain
Go to Semrush.com → Domain Overview → enter the competitor’s domain → select target region.
Step 2: Navigate to Advertising Research
Under the Advertising Research section, you will find:
- Paid keywords: The full list of keywords they are bidding on, with estimated positions, CPC, and monthly traffic.
- Traffic Cost: Semrush’s estimate of the monthly dollar value of their paid traffic, calculated as estimated clicks × CPC for each keyword.
- Ad copies: Their active ad copy, useful for understanding their messaging and offer strategy.
Step 3: Analyse Keyword
Filter their paid keyword list by CPC. High-CPC keywords (e.g., $15+ in competitive Australian verticals) indicate where they are investing most heavily. If the bulk of their paid traffic is sitting on mid-range CPCs with high volume, they are running an efficient, scaled campaign, not a small test budget.
Ahrefs
Ahrefs is primarily known as an SEO tool, but its paid search data is solid for keyword discovery and landing page analysis, two things the other tools handle less precisely.
How to Use Ahrefs
Step 1: Enter Competitor Domain in Site Explorer
Go to Ahrefs → Site Explorer → enter the competitor’s domain → navigate to the Paid Search tab.
Step 2: Analyse Paid Search Data
- Paid keywords: The full keyword list they are bidding on, with estimated CPC and traffic volume.
- Ads: Their live and recent ad copy, useful for identifying tested offers and angles.
- Paid pages: The landing pages receiving their paid traffic. If a competitor is sending paid traffic to a specific service page or product, they have tested that page and it converts.
Step 3: Cross-Reference Paid Keywords with Traffic Value
Ahrefs shows estimated monthly paid traffic and traffic value (clicks × CPC). Use this as your third data point alongside SpyFu and Semrush estimates.
What Ahrefs does well: Landing page intelligence. Knowing where a competitor sends their paid traffic is as strategically important as knowing how much they spend. It tells you what is working for them.
Method 3: Search Manually
Tools give you the estimates, and manual search will provide you with real-time ad visibility.
You can gain insights about keywords, ad positions, frequency and their messaging.
Note: Try to conduct the research in incognito mode on desktop and mobile devices.
How to carry out a manual Google Ads competitive research?
Browser Mode: Use incognito mode to see ads without personalisation. Close and restart the browser after 1-2 searches to start a fresh session.
Primary & Secondary Keywords
- Search for primary and secondary keywords
- Document competitors ad position
- Note how frequently they appear
Timing
This is where manual search earns its value. Businesses with limited daily budgets will exhaust that budget and disappear from results.
It’s worth checking these time slots:
- 6 AM – 9 AM, before peak traffic hits mostly
- 9 AM – 4 PM, costs more to be featured on top
- 4 PM- 7 PM, starts to slow down
- 7 PM – 10 PM, night traffic
- Weekends
Key Points – Timing
- Who is on top during the peak period
- Who appears later in the afternoon or late at night
- Who appears most consistently
- Who appears on the weekend
Ad Formats
Are you seeing search ads only, or are you also seeing display ads following you around after you visit their site (remarketing)?
Remarketing requires additional budget on top of search. If a competitor’s ads follow you after a site visit, that is another layer of spend on top of their search campaigns.
Document Everything
Create a simple spreadsheet. Columns: Date, Time, Keyword, Competitor, Position, Ad present (Y/N).
Run this across 2-3 weeks.
The patterns that emerge (who is consistent, who drops off, who surges on weekdays versus weekends) are more valuable than any single snapshot.
Final Step: Calculate Competitors’ Ad Spend
This is where everything you have gathered comes together. The formula itself is simple.
The accuracy of your output depends entirely on the quality of the inputs you have built across the previous methods.
The Core Formula
Estimated Daily Budget = Average CPC × Estimated Daily Clicks
Estimated Monthly Budget = Estimated Daily Budget × 30.4
Three inputs. Let’s work through each one and then apply it to a real Australian business scenario.
Step 1: Average CPC
Your CPC input needs to reflect the actual competitive CPC in your niche, not the bottom of the bid range.
- Best Source: Your own Google Ads account average CPC over the last 30 days. This is real money you are paying in your actual market, making it the most accurate CPC benchmark available.
- Second best: Google Keyword Planner, using the top-of-page bid (high range) for your primary keywords. Average across 5-10 of your most commercially relevant keywords.
- Cross-Reference: SpyFu and Semrush will both show estimated CPCs for the competitor’s top paid keywords. If their figures broadly align with what you are seeing in your own account or Keyword Planner, you have solid input.
Step 2: Daily Clicks Estimate
Third-Party Tools: SpyFu and Semrush both provide estimated monthly click volumes. Divide by 30.4 to get a daily figure. If both tools show similar click volume (within 20-30% of each other), use the average.
Auction Insights Impression Share: This is the most powerful cross-check available if you are running your own ads. If you know your own monthly spend, your own impression share, and the competitor’s impression share, you can estimate their spend.
Competitor Estimated Spend = (Your Monthly Spend / Your IS%) × Competitor IS%
IS: Impression Share.
This works on the assumption that similar impression share mostly requires similar investment, which holds reasonably well within the same niche and target location.
Manual Search: If a competitor consistently appears across all hours versus dropping off by evening, you can infer whether they are running a low, medium, or high daily budget relative to the average CPC in your vertical.
Step 3: Apply the Formula
Example business name: Melbourne Cosmetic Dental Clinic
You are running Google Ads for the example business (Melbourne Cosmetic Dental Clinic). Your main competitor (Clinic X) appears above you in Google Search(Google Ads) for most searches.
Data gathered across the methods above:
| Data Point | Source | Value |
Average CPC
|
Keyword Planner + own campaign data | $14.50 AUD |
| Estimated monthly paid clicks | SpyFu | 1,350 |
| Estimated monthly paid clicks | Semrush | 1,180 |
| Averaged monthly clicks | Average of both tools | 1,265 |
| Your monthly spend | Own account | $9,500 |
| Your impression share | Auction Insights | 38% |
| Competitor X impression share | Auction Insights | 72% |
| Manual search: ads present after 8pm on weekdays | Manual observation | Yes, consistently |
Primary calculation (formula method):
- Daily clicks: 1,265 ÷ 30.4 = ~42 clicks/day
- Daily budget estimate: 42 × $14.50 = ~$609/day
- Monthly budget estimate: $609 × 30.4 = ~$18,514/month
Cross-check (Auction Insights impression share method):
($9,500 ÷ 38%) × 72% = ~$18,000/month
Both methods land within 1.5% of each other. That is a strong convergence. The estimate is reliable.
What this tells you: Clinic X is spending approximately $18,000–$18,500/month on Google Ads. That is nearly double your current spend. Their consistent evening presence confirms they are not hitting a daily budget cap. They are running a well-funded, always-on campaign.
Using Competitor Data to Your Advantage
You may have all the data about your competition, including budget estimates and more, but if you don’t act on it, it is not going to add value.
A competitor spending $18,000/month with poor or generic keyword targeting and weak landing pages is not a target to match. It is a target to beat them with a much lower budget.
Budget Waste: Find Gaps & Take Action
Find keywords where competitors are wasting budget, spending too much on generic keywords or showing for irrelevant searches with no negative keywords in place.
Your intention should be to cover those gaps smartly with a focused budget and tight negative keywords. You remain competitive, but at a much lower cost.
Invest More: High Conversion Keywords
This will make a real difference to your conversions and revenue.
Be strict on targeting generic keywords to stay competitive, allocate the minimum required budget and monitor the conversion regularly. Do not waste budget.
Invest where it matters, select high conversion keywords, and build campaigns with the required budget that can provide you with more conversions and revenue.
Diversify Within Google Ads
Google Search ads are the most expensive format on the Google Ads platform. If you are in a competitive niche, do not put all the budget into Search alone.
Performance Max campaigns often deliver stronger results at a lower cost than pure Search. Display ads can keep you visible across the web at a fraction of the Search CPC.
Think Beyond Google Ads
If you have a reasonable marketing budget, diversify across channels rather than relying solely on Google Ads. A technical issue, policy restriction, or account suspension can cut off your traffic overnight.
Facebook Ads, Bing Ads, and SEO give you traffic sources that are not dependent on a single platform.
Expert Google Ads Competitor Analysis
The sample data presented above is complex and not easy to compile for most business owners, and you would need expert help to analyse your competition.
At webapex, we carry out in-depth competitor analysis for businesses serious about gaining momentum with Google Ads advertising. Depending on the Google Ads management plan, we can provide a general overview of your competition or in-depth insights with actionable items to build a stronger online presence
Google Ads case study
Check out our Google Ads case study page. We increased conversions by 281.81%, not by simply increasing the budget, but by outperforming the competition through strategic research, planning, and implementation.
We implemented full conversion tracking, audited the keyword landscape against what competitors were bidding on, and rebuilt the campaigns to target the right audience with the right budget allocation. Every dollar tracked. Every gap in competitor coverage targeted deliberately.
Visit our Google Ads service page to learn more about our services.
FAQs
Can I see my competitors' exact Google Ads budget?
No. Google does not share any advertiser's exact budget or spend data publicly. Third-party tools and the methods above can only produce estimates, but with the right combination of data sources.
Is a higher Google Ads budget always an advantage against competition?
Not necessarily. A higher budget is definitely an advantage, but a well-structured campaign with precise keyword targeting, strong ad copy, and high-converting landing pages can outperform higher competitor ad spend.
Which third-party tool is most accurate for Australian businesses?
No single tool is perfectly accurate for Australia. Google’s own tools are the best to get quick and early insights. By combining third-party tools, data can be validated for higher accuracy.
Does top ad position always mean the biggest budget?
Not always. A strong Quality Score reduces the CPC. But a competitor holding the top position consistently across many keywords over weeks and months, not just occasionally, is a reliable indicator of sustained spend, not just good Quality Score.

