The click-through rate (CTR) is an important metric across all digital marketing efforts, from Google Ads and SEO to Facebook, TikTok, Email Marketing, and more.
A higher CTR not only improves your ad position but signals that your message resonates with your audience. With Google Ads, CTR directly influences keyword quality scores, shaping both your visibility and cost-per-click (CPC).
The same principle applies across SEO, Facebook Ads, TikTok, Email Marketing, and other channels. A higher CTR indicates better alignment between your message, audience, and placement.
In this guide, you will learn what a good CTR looks like across each of these channels, including industry benchmarks to help you measure your own performance.
Table of contents:
- What is CTR?
- What is a good CTR?
- What is a good CTR for Google Ads?
- What is a good CTR for Facebook Ads?
- What is a good CTR for SEO?
- How AI Overviews Affect SEO CTR?
- What is a good CTR for Email Marketing?
- What is a good CTR for TikTok Ads?
- Is My CTR Good?
- How to Improve CTR?
- FAQs
What is CTR?
Click-through rate (CTR) is the percentage of people who see your ad or search result and click on it. It is calculated using this formula:
CTR = (Total Clicks / Total Impressions) x 100
For example, if your ad received 100 clicks from 1000 impressions, your CTR would be 10%.
A higher CTR for Google Ads indicates that a greater number of people find your content interesting enough to click on the link. On the contrary, a low CTR is feedback that the content needs improvement.

Impact of CTR
Understanding the impact of CTR helps advertisers optimise their marketing strategies to achieve better results.
In Google Ads, CTR directly influences your Quality Score. A higher Quality Score improves your Ad Rank, which means better visibility in search results and a lower cost per click. In short, a better CTR can mean you pay less and appear higher at the same time.
Across SEO and paid social platforms like Facebook and TikTok, a higher CTR signals that your message is resonating with the right audience. It is one of the clearest indicators of how well your content, targeting, and placement are working together.
What is a good CTR?
Click-through rate (CTR) varies significantly by platform. Here is what a good CTR looks like across the key channels:
- Google Search Ads: 6.66% average across all industries. Above 8% is a strong performance.
- Google Display Ads: 0.46% average. Above 0.5% is solid; above 1% is exceptional.
- Facebook Ads (Traffic): 1.71% average. Above 3% is strong.
- Facebook Ads (Leads): 2.59% average. Above 4% is strong.
- SEO (Organic): Position 1 averages 27.6% CTR. Above 3% overall is considered good.
- Email Marketing: 2.09% average. Above 3.5% puts you in the top tier.
- TikTok Ads: 0.57% average. Above 0.73% is strong.
Even within the same platform, benchmarks vary depending on your industry and campaign objective. Google Search and Display operate very differently, as do Facebook Traffic and Leads campaigns. The sections below have industry-specific breakdowns for different advertising platforms.
What is a good CTR for Google Ads?
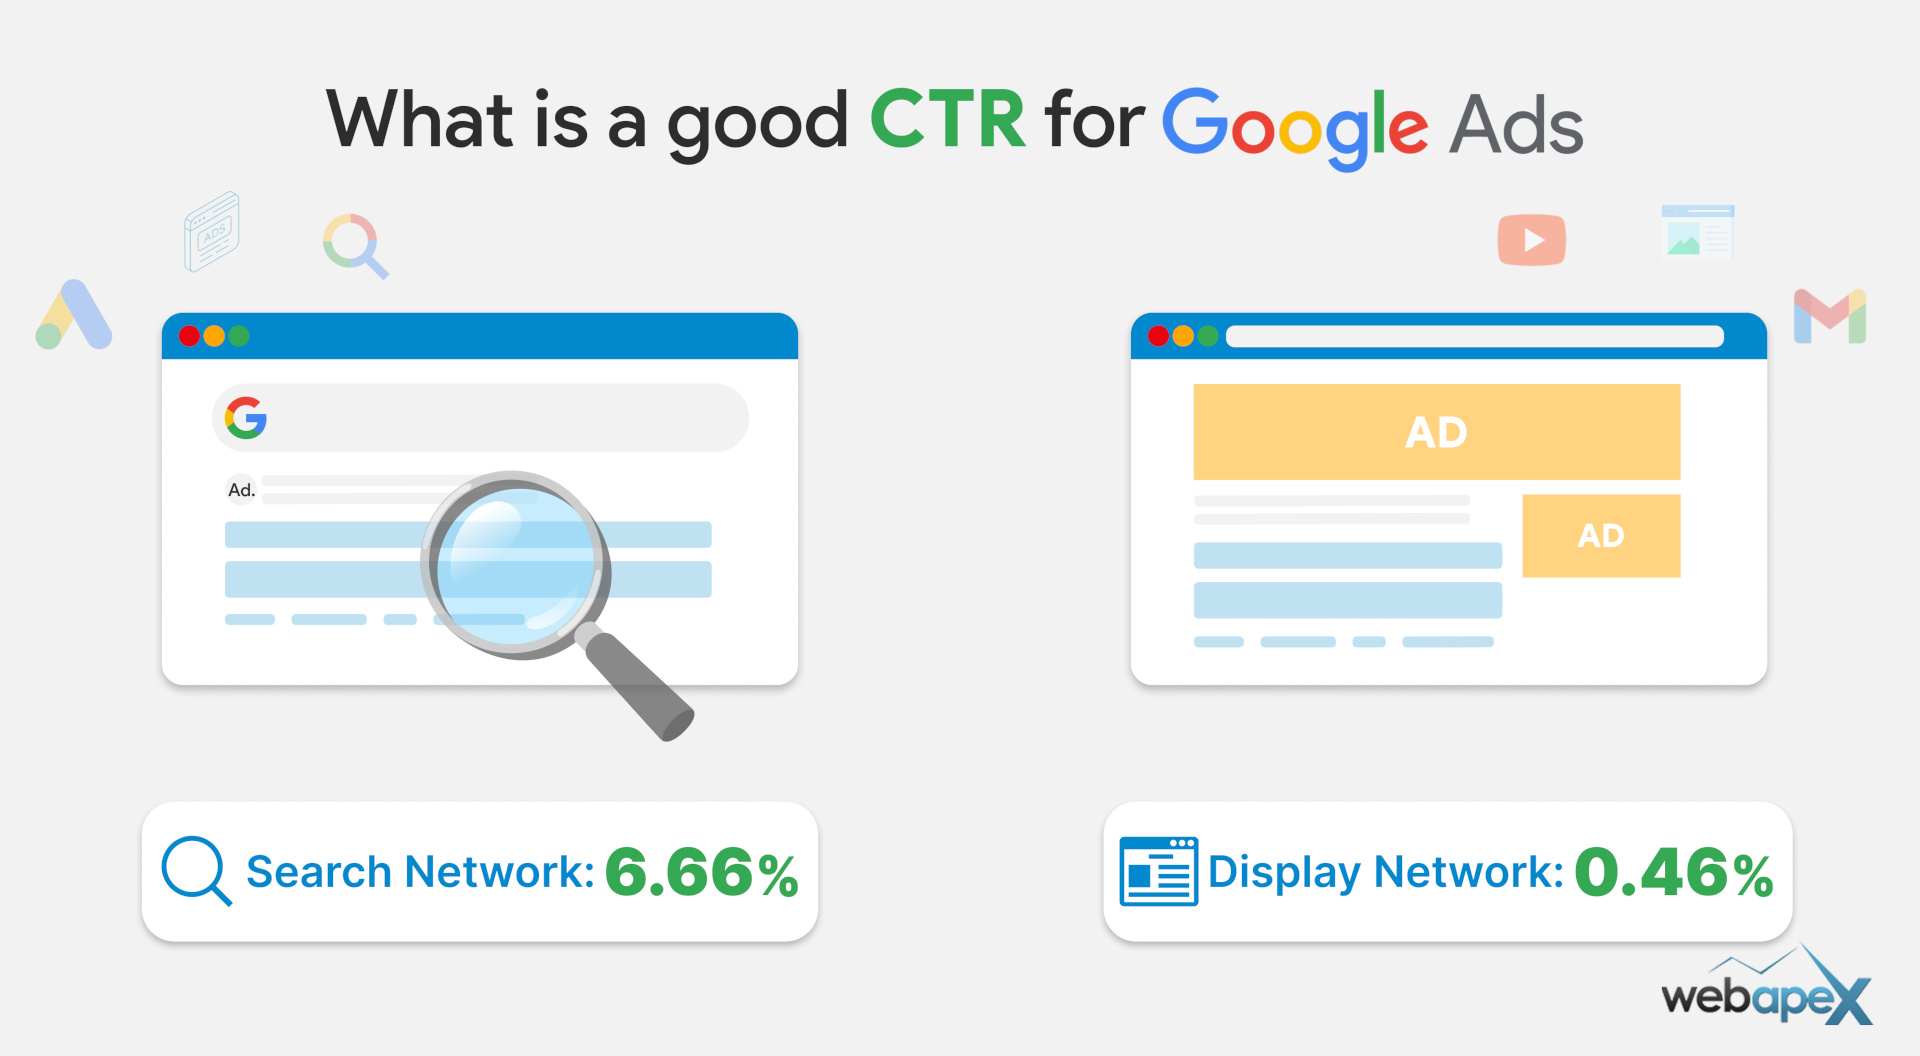
A good click-through rate (CTR) for Google Ads is: 6.66% for Search Ads and 0.46% for Display Ads.
Google Ads runs across two very different networks, search and display, and CTR behaves differently on each. Search ads reach people who are actively looking for something. Display ads reach people while they are browsing. Understanding which network you are on is the starting point for evaluating your CTR.
Google Ads Search Network CTR Benchmarks
The average CTR for the Google Ads search network across industries are listed below:
| Industry | Average CTR |
| Animals & Pets | 6.58% |
| Apparel / Fashion & Jewellery | 6.77% |
| Arts & Entertainment | 13.10% |
| Attorneys & Legal Services | 5.97% |
| Automotive – For Sale | 8.29% |
| Automotive – Repair, Service & Parts | 5.56% |
| Beauty & Personal Care | 5.71% |
| Business Services | 5.65% |
| Career & Employment | 6.57% |
| Dentists & Dental Services | 5.44% |
| Education & Instruction | 5.74% |
| Finance & Insurance | 8.33% |
| Furniture | 6.11% |
| Health & Fitness | 7.18% |
| Home & Home Improvement | 6.37% |
| Industrial & Commercial | 6.23% |
| Personal Services | 7.69% |
| Physicians & Surgeons | 6.73% |
| Real Estate | 8.43% |
| Restaurants & Food | 7.58% |
| Shopping, Collectibles & Gifts | 8.92% |
| Sports & Recreation | 9.19% |
| Travel | 8.73% |
Google Ads Display Network CTR Benchmarks
Since display ads reach people who are not actively searching for your product, CTRs are naturally much lower than search. Here is how it breaks down by industry:
| Industry | Average CTR |
| Advocacy | 0.59% |
| Auto | 0.60% |
| B2B | 0.46% |
| Consumer Services | 0.51% |
| Dating & Personals | 0.72% |
| E-Commerce | 0.51% |
| Education | 0.53% |
| Employment Services | 0.59% |
| Finance & Insurance | 0.52% |
| Health & Medical | 0.59% |
| Home Goods | 0.49% |
| Industrial Services | 0.50% |
| Legal | 0.59% |
| Real Estate | 1.08% |
| Technology | 0.39% |
| Travel & Hospitality | 0.47% |
Display Network data sourced from WordStream industry benchmarks. Category names reflect the original data classification.
Data source: WordStream.
What is a good CTR for Facebook Ads?
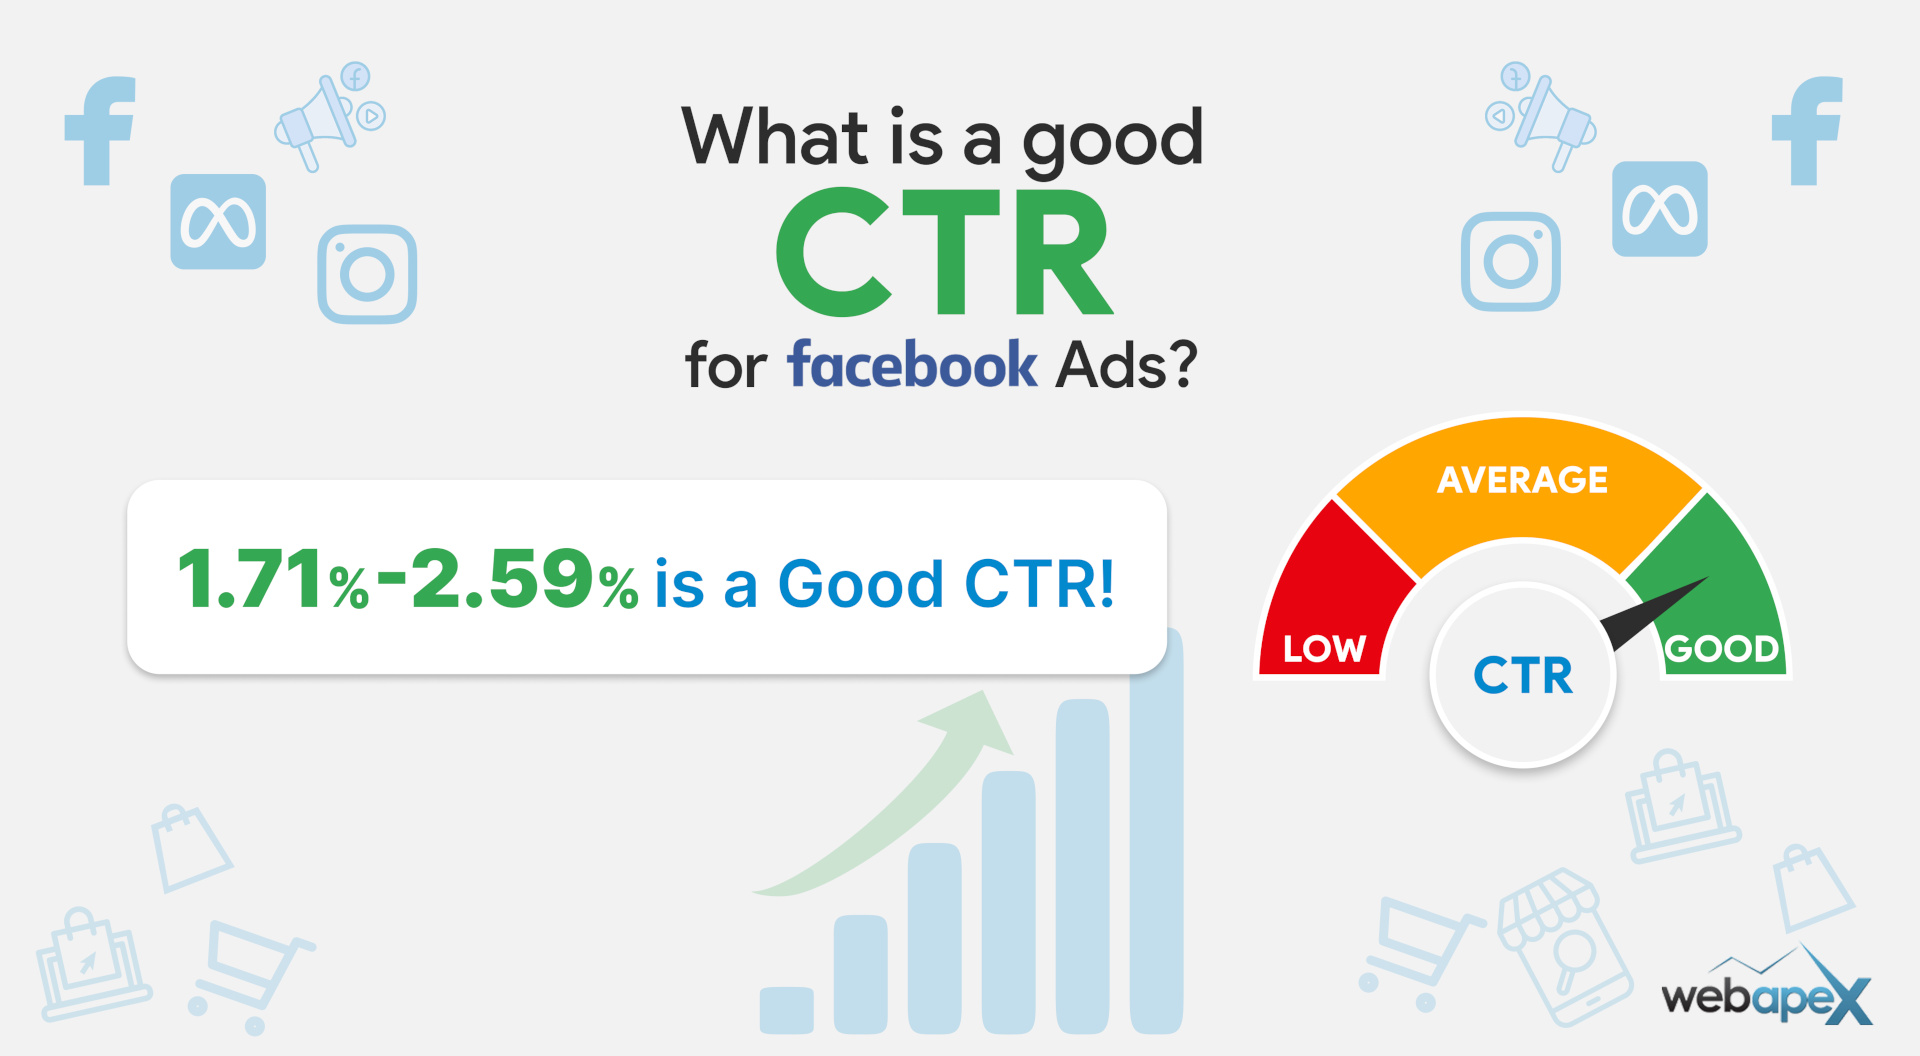
A good click-through rate (CTR) for Facebook Ads is: 1.71% for Traffic campaigns and 2.59% for Lead campaigns.
Unlike Google search ads, Facebook ads reach users who are not actively looking for a product. They appear while people are scrolling through their feed, which is why CTRs tend to be lower compared to search advertising.
Facebook Ads Benchmarks: Traffic Campaigns
| Industry | Average CTR |
| Animals & Pets | 1.64% |
| Apparel / Fashion & Jewellery | 1.29% |
| Arts & Entertainment | 2.10% |
| Attorneys & Legal Services | 1.76% |
| Automotive – For Sale | 1.48% |
| Automotive – Repair, Service & Parts | 0.80% |
| Beauty & Personal Care | 1.81% |
| Business Services | 1.38% |
| Education & Instruction | 1.45% |
| Finance & Insurance | 0.98% |
| Furniture | 1.39% |
| Health & Fitness | 1.63% |
| Home & Home Improvement | 1.28% |
| Industrial & Commercial | 1.36% |
| Personal Services | 1.70% |
| Physicians & Surgeons | 0.83% |
| Real Estate | 1.68% |
| Restaurants & Food | 1.67% |
| Shopping, Collectibles & Gifts | 4.13% |
| Sports & Recreation | 2.60% |
| Travel | 2.76% |
Data Source: WordStream
Facebook Ads Benchmarks: Leads Campaigns
| Industry | Average CTR |
| Arts & Entertainment | 3.92% |
| Attorneys & Legal Services | 2.11% |
| Beauty & Personal Care | 2.55% |
| Career & Employment | 2.81% |
| Dentists & Dental Services | 1.05% |
| Education & Instruction | 1.86% |
| Furniture | 1.48% |
| Health & Fitness | 1.72% |
| Home & Home Improvement | 1.94% |
| Industrial & Commercial | 2.08% |
| Personal Services | 1.99% |
| Physicians & Surgeons | 3.02% |
| Real Estate | 3.75% |
| Restaurants & Food | 2.97% |
| Sports & Recreation | 3.41% |
Data Source: WordStream
What is a good CTR for SEO?
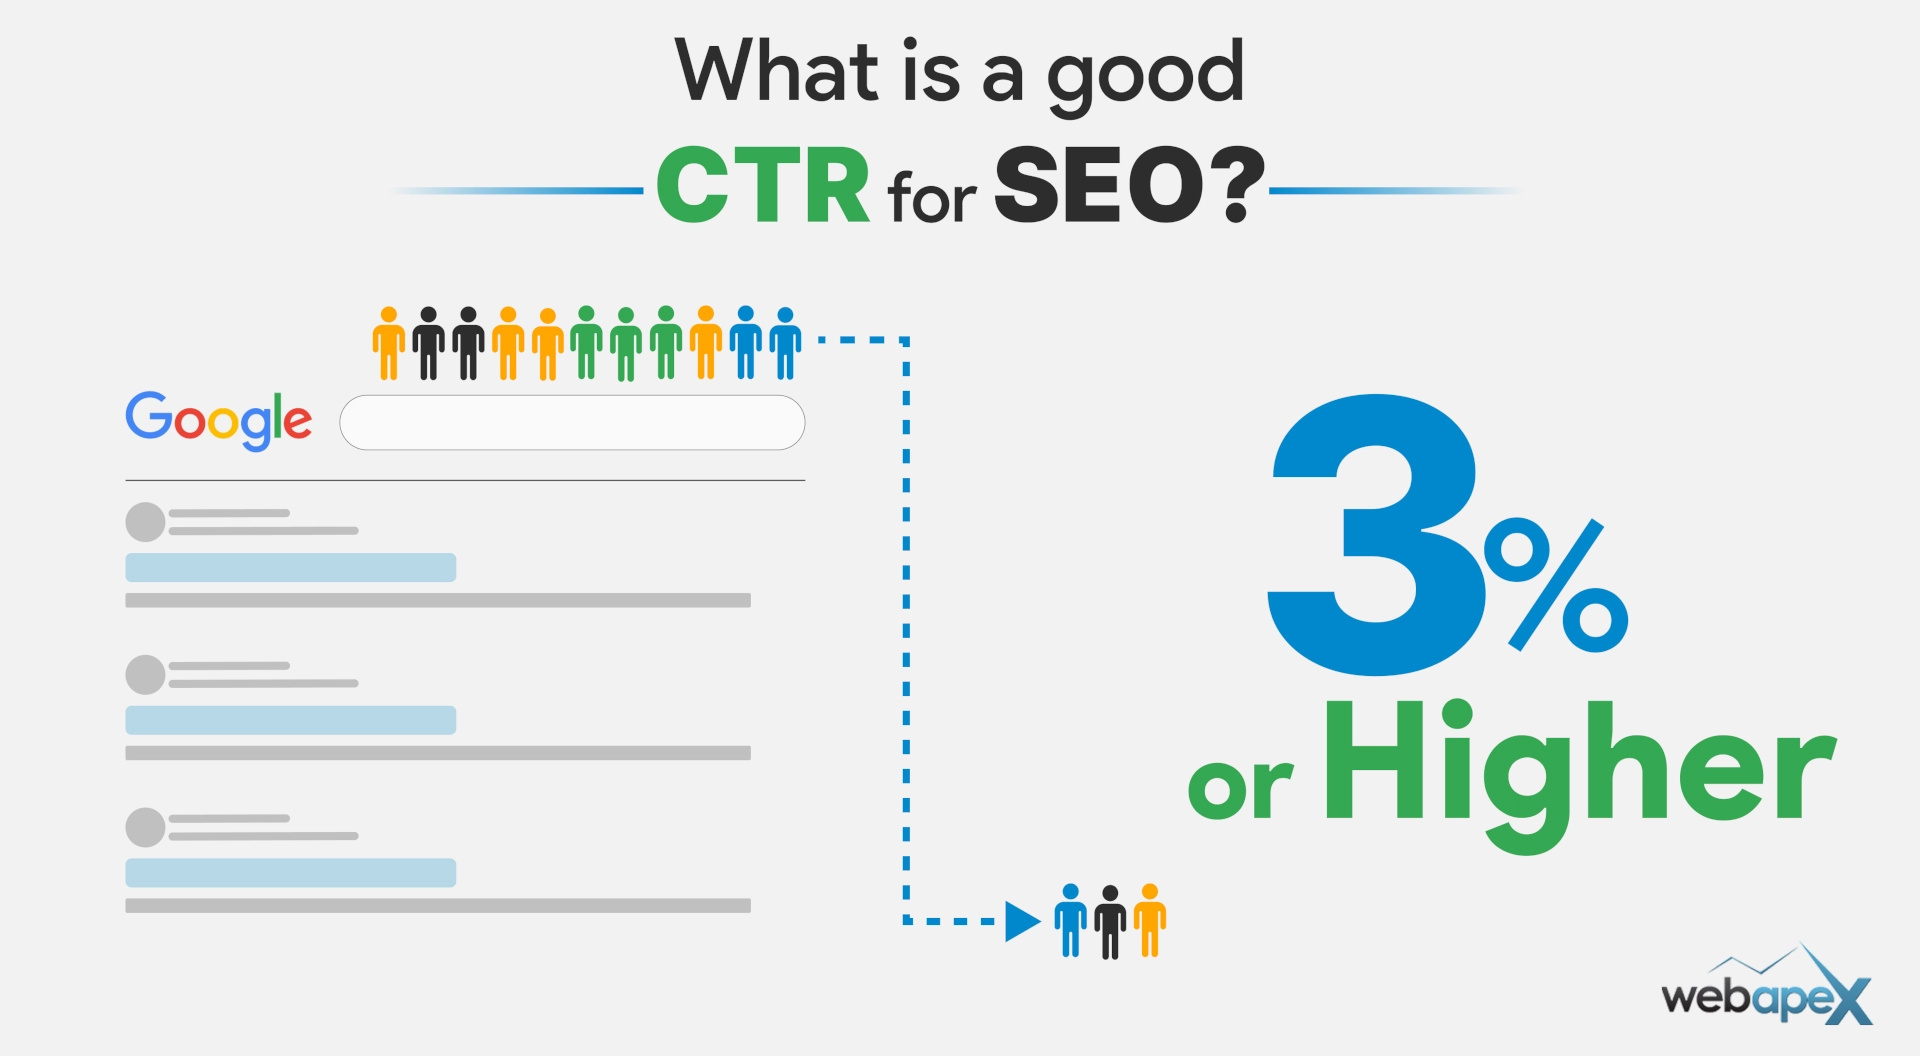
A click-through rate (CTR) above 3% is generally considered good for SEO; however, you need to rank relatively well to achieve this benchmark.
Organic CTR measures how often users click on your site after seeing it in search results (impressions). Since these clicks are not paid, they reflect how effective your title tag and meta description are at attracting attention.
However, CTR varies significantly depending on ranking position.
Data Source: Backlinko
SEO CTR benchmark based on SERP position
The higher you rank, the more clicks you’re likely to get. Here’s how CTR typically changes across positions:
| Organic Search (Result Position) | Click-Through Rate |
| 1 | 27.6% |
| 2 | 15.8% |
| 3 | 11.0% |
| 4 | 8.4% |
| 5 | 6.3% |
| 6 | 4.9% |
| 7 | 3.9% |
| 8 | 3.3% |
| 9 | 2.7% |
| 10 | 2.4% |
But ranking position isn’t the only factor.
Branded keywords, where users search specifically for your brand, tend to perform very differently.
Organic CTR breakdowns for branded keywords
Because users already recognise the brand, they are far more likely to click on those results. This leads to significantly higher CTRs compared to non-branded searches:
| Organic Search Result Position | Click-Through Rate |
| 1 | 60.4% |
| 2 | 21.5% |
| 3 | 14.2% |
| 4 | 11.0% |
| 5 | 9.2% |
| 6 | 8.7% |
| 7 | 6.8% |
| 8 | 6.1% |
| 9 | 5.4% |
| 10 | 3.7% |
How AI Overviews Affect SEO CTR
Google’s AI Overviews now appear at the top of search results for many informational queries, answering the user’s question before they ever reach the organic listings. You need to think beyond just traditional SEO to appear in the AI overview, leading to higher CTR.
According to Ahrefs, AI Overviews reduce clicks by an average of 34.5%. That means a page that previously earned strong organic traffic can see a significant drop in CTR simply because the AI summary is satisfying the search intent at the top of the page.
The impact is not equal across all queries, though. Informational searches, the kind where someone is looking for a quick answer, are the most affected. Transactional and navigational queries, where users want to visit a specific site or take an action, tend to be less impacted.
What this means practically is that CTR benchmarks for informational content are likely lower today than the figures in the tables above suggest. If your SEO CTR has dropped recently without a change in ranking position, AI Overviews could be a contributing factor worth investigating in Google Search Console.
What is a good CTR for Email Marketing?
The average email click rate across all industries is 2.09%.
Email click rate, also known as click-through rate, measures the percentage of recipients who clicked on a link in your email. It is currently one of the most reliable indicators of email engagement, especially since Apple’s privacy changes have made open rates less accurate to track.
Keep in mind that click rate is also influenced by how many links your email contains. If you do not include many links, your click rate will naturally be lower, but that does not necessarily mean people are not reading your content.
Click rates across industries range from 0.83% to 4.90%. Here is how email CTR breaks down by industry:
| Industry | Click rate benchmark |
| Agency | 1.85% |
| Agriculture and food services | 1.83% |
| Architecture and construction | 1.68% |
| Art gallery and museum | 2.66% |
| Artist | 2.52% |
| Author | 2.75% |
| Beauty and personal care | 0.95% |
| Blogger | 3% |
| Business and finance | 2.37% |
| Coaching | 1.42% |
| Computers and electronics | 1.37% |
| Construction | 3.53% |
| Consulting | 2.41% |
| Creative services/agency | 1.87% |
| e-commerce | 1.07% |
| Educational institution | 1.93% |
| Entertainment and events | 1.28% |
| Games | 2.11% |
| Government | 3.05% |
| Health and fitness | 1.45% |
| Higher education | 2.15% |
| Hobbies | 3.3% |
| Home and garden | 1.75% |
| Insurance | 1.36% |
| Legal | 4.9% |
| Manufacturing | 4.22% |
| Marketing and advertising | 1.3% |
| Media | 4.1% |
| Medical, dental, and healthcare | 2.25% |
| Music and musicians | 1.7% |
| Non-profit | 2.9% |
| Online courses | 1.39% |
| Other | 2.15% |
| Photo and video | 1.59% |
| Politics | 0.83% |
| Public relations | 2.02% |
| Publishing company | 2.82% |
| Real estate | 1.72% |
| Recruitment and staffing | 1.68% |
| Religion | 2.95% |
| Restaurants and cafes | 1.06% |
| Retail | 1.27% |
| Software and web app | 1.15% |
| Sports | 1.27% |
| Telecommunications | 1.49% |
| Travel and transportation | 1.68% |
Data Source: MailerLite
What is a good CTR for TikTok Ads?
TikTok’s full-screen video format means users engage with content differently than they do with static feed ads. This is why TikTok CTRs tend to be structurally lower than platforms like Meta, and that is expected behaviour for the format rather than a sign of underperformance.
Here is how TikTok Ads CTR breaks down by industry:
| Industry | Average CTR |
| Apparel & Accessories | 0.69% |
| Beauty | 0.58% |
| Home & Garden | 0.68% |
| Food & Beverage | 0.58% |
| Toys, Art, & Collectibles | 0.58% |
| Sports & Outdoors | 0.52% |
| Electronics | 0.73% |
| Health & Wellness | 0.57% |
| Pets & Animals | 0.49% |
| Lifestyle & Boutique | 0.57% |
Data Source: Triple Whale
Is My CTR Good?
Knowing the average CTR is useful, but it does not tell you whether your own numbers are good or not. The honest answer depends on your platform, your industry, and your goals.
Here is a simple framework to evaluate where you stand:
| Performance | Google Ads (Search) | Facebook Ads (Traffic) | Facebook Ads (Leads) | Email Marketing | TikTok Ads | SEO |
| Poor | Below 3% | Below 0.8% | Below 1.2% | Below 1% | Below 0.3% | Below 1% |
| Average | 3% to 5% | 0.8% to 1.71% | 1.2% to 2.59% | 1% to 2.09% | 0.3% to 0.57% | 1% to 3% |
| Good | 5% to 8% | 1.71% to 3% | 2.59% to 4% | 2.09% to 3.5% | 0.57% to 0.73% | 3% to 5% |
| Excellent | Above 8% | Above 3% | Above 4% | Above 3.5% | Above 0.73% | Above 5% |
Keep in mind that these are general ranges. Some industries naturally sit higher or lower than these thresholds, which is why checking your industry benchmark from the tables above is always the better starting point.
How to Improve CTR?
A good CTR does not happen by accident. Across every platform, the same principle applies: the right message needs to reach the right person at the right time. Here is what to focus on for each channel.
Google Ads
The two biggest levers in Google Ads CTR are your ad copy and your ad position. Here is how to improve both:
- Write compelling headlines. Your headline is the first thing people see. Try to include a real offer or hook so that users are compelled to click on your ad. Example “Up to 40% Clearance Sale” will always outperform “Shop our Range of Shirts.”
- Match your ad to the search intent. If someone searches “mens wedding shirts” your ad should speak directly to that. Generic ads that do not match intent will always underperform.
- Improve your Quality Score. A higher Quality Score improves your Ad Rank, which means better placement and more clicks. The three things that influence it most are keyword relevance, ad copy, and landing page experience. If you want to go deeper on this, we have a full guide on how to improve your keyword Quality Score in Google Ads.
- Test regularly. Run A/B tests on headlines and descriptions. Small changes in wording can make a noticeable difference to CTR over time.
Facebook Ads
On Facebook, your audience targeting and creative are the two things that move CTR the most.
- Get the targeting right first. A great ad shown to the wrong audience will not get clicks. Narrow your audience to people who are most likely to care about what you are offering.
- Use strong visuals. Facebook is a visual platform. Your image or video needs to stop someone mid-scroll. High-quality, eye-catching visuals consistently outperform generic stock images.
- Lead with a clear hook. The first line of your ad copy needs to grab attention immediately. Ask a question, state a problem, or make a bold statement that speaks directly to your audience.
- Match the creative to the placement. Design your ad creative to fit each placement’s format and user behaviour, ensuring it looks native and performs better. For example, use vertical video for Stories and Reels, and more detailed visuals for Feed placements.
- Test different formats. Reels and video ads tend to drive higher engagement than static images. If you are only running image ads, test video and see what happens to your CTR.
SEO
In SEO, your CTR is largely determined by your ranking position and how compelling your title and meta description are. Here is what to focus on:
- Improve your ranking position. The single biggest driver of SEO CTR is where you rank. Moving from position five to position two can more than double your clicks. Focus on building quality content and earning backlinks to move up.
- Write better title tags. Your title tag is your headline in search results. Keep it between 55 and 60 characters, include your target keyword, and make it specific and compelling. Titles with numbers, questions, or clear benefits tend to get more clicks. Use our Meta Title Length Checker to preview, compare and use the one that looks compelling to drive clicks.
- Optimise your meta description. You can’t include everything in the meta title; the description tag allows you to include secondary keywords and support your title tag to make a strong impression, leading to more clicks.
- Use structured data. Schema markup can add star ratings, pricing, FAQs, and other rich results to your listing, making it stand out visually in search results and increasing CTR.
Email Marketing
Getting a higher email CTR comes down to two things: who you are sending to and what you are sending them.
- Segment your list. Sending the same email to everyone rarely works. The more relevant the email is to the recipient, the more likely they are to click. Segment by behaviour, purchase history, or interest to improve relevance.
- Write a compelling subject line. Your subject line determines whether the email gets opened at all. Keep it short, specific, and curiosity-driven without being clickbait.
- Make your call to action clear. One clear call to action performs better than multiple competing links. Tell the reader exactly what to do and why it matters.
- Send at the right time. Timing affects both open rates and click rates. Test different send times to find what works best for your audience.
- Use automation. Triggered emails based on user behaviour consistently outperform broadcast campaigns. Welcome sequences, abandoned cart emails, and post-purchase follow-ups all tend to drive higher CTRs than one-off sends.
TikTok Ads
On TikTok, the creative is everything. Unlike search ads, where intent drives clicks, TikTok relies entirely on stopping power and relevance.
- Hook the viewer in the first two seconds. TikTok users scroll fast. If your ad does not grab attention immediately, they will keep scrolling. Lead with something visually striking or a bold statement.
- Make it feel native. Ads that look like ads get scrolled past. The best performing TikTok ads look and feel like organic content. Use the platform’s natural style, trends, and sounds.
- Use text overlays. Many users watch without sound. Adding text overlays ensures your message lands even when the audio is off.
- Test UGC style content. User-generated content style videos tend to outperform polished production on TikTok. Authenticity drives clicks more than high production value.
- Match your offer to the audience. TikTok skews younger and is heavily ecommerce-driven. Make sure your product and offer resonate with the platform’s user base before investing heavily.
Get expert help to improve your CTR
We provide holistic data-driven online marketing to help customers get the best result possible, and CTR is one of the metrics that we consider to assess the impact of campaigns across different advertising channels.
Visit our services pages to learn more and enquire to book a consultation with one of our experts.
FAQs
What is click-through rate (CTR)?
CTR is the percentage of people who see a search result or ad and click on it. It is calculated by dividing clicks by impressions, then multiplying by 100.
Why does CTR matter in Google Ads?
CTR helps show how relevant your ads are to searchers, and it can influence Quality Score. A stronger Quality Score can improve ad efficiency and help reduce cost-per-click.
How do CTR benchmarks vary by industry?
CTR benchmarks differ widely because industries have different audience intent, competition levels, and buying cycles. That’s why benchmark data should be used as a reference point rather than a fixed target.
Does branded search usually get a higher CTR?
Yes. Branded keywords often attract much higher CTRs because users already know the brand and have stronger intent to click.
Should I focus mainly on CTR?
No. CTR is important, but it should be reviewed alongside conversion rate, CPA, and return on investment.
What is a poor CTR and what should I do about it?
A poor CTR means your ad or page is not compelling enough to get clicks. Start by checking your industry benchmark to understand where you stand, then focus on improving your headline, targeting, and relevance before anything else.
Does AI Overview affect my SEO CTR?
Yes. According to Ahrefs, AI Overviews reduce organic clicks by an average of 34.5%. If your CTR has dropped without a change in ranking position, AI Overviews appearing for your target queries could be a contributing factor.

